Prior to the landings on 6 June 1944 on the Normandy beaches, a small research group was formed in the Admiralty Research Laboratory at Teddington in Middlesex.
Weather and wave prediction had been central to the decision made by Eisenhower about the timing of the Normandy landings. The new group, Group W, was charged with learning how waves are generated and how they travel away from storms so that useful predictions could be made of wave conditions for amphibious landings that might be made in the Pacific. Here it was expected that swell waves from distant storms would be more important than in the English Channel.
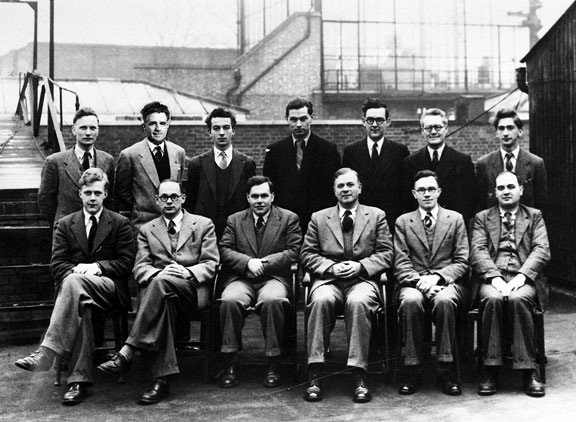
Group W (for waves) was made up of young mathematicians and physicists and was led by Dr (later Sir) George Deacon, FRS. Deacon was a chemist and oceanographer who since 1927 had worked with the Discovery Investigations learning about the physics and chemistry of the vast Southern Ocean so he had plenty of practical experience of waves.He took it as a good omen two weeks later a horse called Ocean Swell won the Derby.
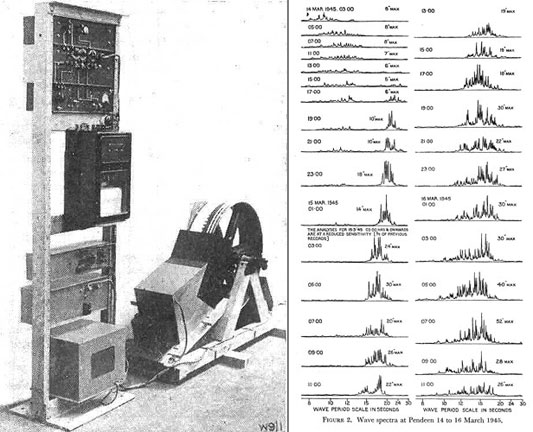
Group W scientists and technicians started to measure waves on the beach at Perranporth in North Cornwall – a place where there would be both short period local waves and low frequency swell waves. The next challenge was to learn how to analyse the wave records so as to separate the effects of waves and swell. Inspiration came from an unexpected source. Deacon had a friend in the film industry and learned that the sound track on films at that time was recorded as a wavy line alongside the picture frames. The same method was used for the 20 minute-long wave records. The records were mounted on a large spinning drum and as the drum slowed the output of a photocell changed according the amount of wave energy at each frequency. This produced a wave energy spectrum. The records taken at two hour intervals showed the longest swell waves from storms arrived first followed by the shorter, local waves.
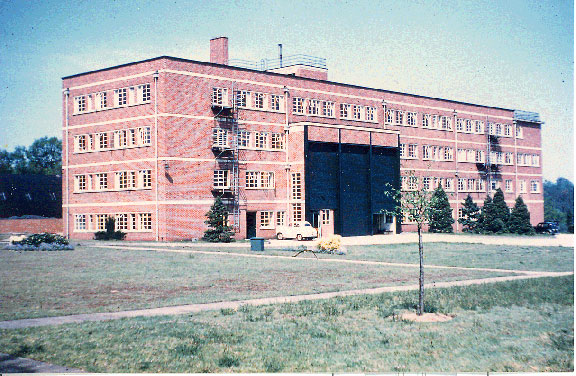
The war ended in August 1945 but Group W continued its wave research and broader studies of the interactions between the atmosphere and ocean. On 1 April 1949 Group W combined, under Deacon’s direction, with the researchers of the Discovery Investigations to form the multidisciplinary National Institute of Oceanography (NIO). In 1953 the NIO moved to a wartime Admiralty radar research laboratory at Wormley near Godalming in Surrey. This remained the home of UK oceanography until 1995 when the lab moved to Southampton to form the Southampton (now National) Oceanography Centre.
Group W was remarkable. Six of its scientists became Fellows of the Royal Society in recognition of their work. That work work laid the foundations of UK (and indeed international) wave research that had important practical applications particularly during the 1970s and 80s in the design of offshore structures for use in the North Sea.

The history of these developments is described in the book “Of Seas and Ships and Scientists” published in 2010.
The book is available from Lutterworth Press.
Arthur Doodson and tidal predictions for the Normandy landings
The following are some paraphrased extracts from an article by Bruce Parker in Physics Today in 2011.
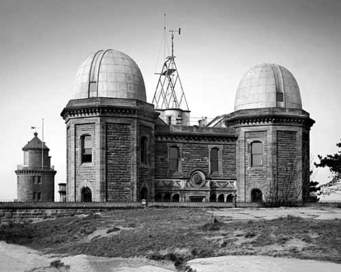 All the Admiralty tide and tidal-current predictions for the war effort were produced by Arthur Thomas Doodson, then Director at the Liverpool Tidal Institute, at Bidston Observatory in Birkenhead, Wirral, near Liverpool (the Observatory is the predecessor of the National Oceanography Centre’s present laboratory in Liverpool). The 53-year-old Doodson was at that time the world’s leading authority on tide prediction. He used two tide-predicting machines: the Kelvin machine, built in 1872 but overhauled in 1942, and the Roberts-designed machine, built in 1906. The two machines were put in separate rooms at the observatory to minimize the chance of a bomb destroying both. That was a very real possibility as many bombs did fall near the observatory, which was a German target as well as the docks and ship-building on the Mersey in Birkenhead and Liverpool. Both tide predicting machines survived and were kept running from early morning to late at night, seven days a week. As a precaution, predictions for all the ports in the Admiralty Tide Tables were completed two years ahead of time. But the machines were also required for many additional predictions for wherever around the world the Allies needed them. By 1943, because of the war effort’s demands for educated personnel, the technical staff at the Liverpool Tidal Institute had been reduced to just Doodson and six young women who carried out the thousands of tabulations and arithmetic computations required for tidal analysis. Their additional duties included night-time fire watch on the roof in tin helmets and trench coats and carrying buckets of water in case an incendiary bomb hit the observatory.
Tide predictions for Normandy
On 15 July 1943, Lieutenant General Frederick Morgan sent his plan for Operation Overlord – the code name for the Allied invasion of northern Europe – to the British Chiefs of Staff. He had determined that the best site for the invasion was the stretch of Normandy beaches in the Bay of the Seine. His recommendation was accepted the following month by the Allied command. At that time, the Admiralty’s superintendent of tides at the Hydrographic Office was William Ian Farquharson, a 43-year-old commander in the Royal Navy, who became responsible for finding a way to provide Doodson with the harmonic constants – or the data to calculate them – he would need for making accurate tide predictions for the landing beaches. But because of extremely tight security, Farquharson could not tell Doodson the biggest secret of the war – that the landings were to take place in Normandy. So he labelled the coastal location to which a particular set of harmonic constants or tidal data belonged with a code name. And he, in Bath, and Doodson, in Liverpool 200 km away, used those code names in their exchange of letters and telegrams.
To produce accurate tide predictions for the Normandy beaches, Doodson ideally needed accurate harmonic constants calculated from tide data measured at or very near each landing beach. But the British had no such data. The only harmonic constants they had were for the two French ports that bracketed the beaches: Le Havre to the east and Cherbourg to the west. Simple interpolation would not work, because shallow-water conditions varied from place to place. Shallow-water distortion of the tide can speed up the rise from low to high water, giving the demolition teams, sent ashore to break through the German defences, less time to do their work. Very accurate shallow-water tidal data from the beaches themselves were therefore essential. The 1943 Admiralty Tide Tables did include three locations near the Normandy beaches, but all three were secondary stations, and the tables contained warnings about the probable inaccuracy of predictions for those locations. Farquharson desperately needed tide data direct from the invasion beaches, so British teams in small boats and midget submarines carried out several secret midnight reconnaissance missions on the enemy beaches. Those dangerous missions did yield a few tide and current measurements, but much less than is normally required for tidal analysis. On 9 October 1943, Farquharson sent Doodson a three-page handwritten letter marked “MOST URGENT” which included 11 pairs of harmonic constants for the location code-named “Position Z.” He asked Doodson to produce hourly height predictions for four months commencing 1 April 1944. “The place is nameless and the constants inferred,” he wrote. “There is in fact very little data for it. I am gambling on the inferred shallow-water constants giving something like the right answer.” It is still not known how Farquharson came up with those 11 pairs of harmonic constants. Probably he modified the Le Havre constants in such a way as to match the shape of a measured tide curve determined from the little bit of water-level data collected by one of the reconnaissance teams. He may also have taken into consideration the time and height differences found in the Admiralty Tide Tables. In any case, Farquharson’s harmonic constants for the Normandy beaches compare favourably with those derived from modern hydrodynamic tide models of the English Channel. Doodson put Farquharson’s harmonic constants on his tide-predicting machines to produce the tide predictions for D-Day. (Years later Doodson admitted that he had guessed from those harmonic constants that the Normandy beaches were the intended landing site.) Doodson’s tide predictions were then modified at the Hydrographic Office for each of the landing beaches and provided to the military planners and commanders in a variety of convenient ways. Most important were the tidal and illumination diagrams, which combined the tide predictions with additional information about moonrise, moonset, sunrise, sunset, and various degrees of twilight.
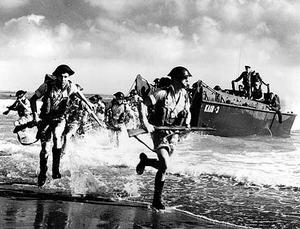
The D-Day landings
Tides had been the key factor in selecting 5, 6, and 7 June as the three days most suitable for D-Day. But it was weather that ultimately determined on which of those days the invasion was launched. Bad weather, with high winds, high waves, and high surf on the beaches, would make an amphibious landing impossible. It would also mean no air support and very inaccurate naval gunfire, as well as low clouds and poor visibility for the airborne operations during the night before the landing. June weather was usually good on the Normandy coast. But in 1944 bad June weather ended up delaying D-Day from the original 5 June date chosen by General Dwight Eisenhower and his staff. Eisenhower’s decision to go one day later, based on his meteorologists’ forecast of a 36-hour break in the weather, is credited with being a critical factor in surprising the Germans. Rommel, having concluded that the weather was too bad for an invasion during that stretch, left his headquarters on 5 June and went to Germany to spend the next day with his wife on her birthday. There was, however, one more reason for the reduced German preparedness on 6 June: Rommel, still believing that the Allies must come at high tide, thought the 6 June tides would not suit them.
Once the invasion began, the tide predictions proved to be quite accurate. The D-Day landings might be considered the ultimate success for those big, brass tide-calculating machines. They continued in use by the British, Americans, Germans, and others into the 1960s, when digital computers finally took over. One of the tide-predicting machines used for the D-Day landing is on display at the Tide and Time exhibition at the National Oceanography Centre's Liverpool laboratory.
View online: The Tide Prediction for D-Day by Bruce Parker.
Visit the Tide and Time exhibition website