

What is Sea Level Rise?
The ocean is rising, and it's picking up speed. Between 1924 and 2024, global mean sea levels have climbed by 21.05 centimetres, reshaping coastlines and putting billions of people at growing risk. Why it's happening, how fast it's accelerating, and what it all means for the decades ahead are some of the most urgent questions facing climate science right now.
Put simply, sea level rise is the increase in the average height of the ocean's surface over time. It's different from tides or short-term wave action. Sea level rise is a long-term trend, measured across decades and centuries, and it's one of the clearest signs of a changing climate.
How Long Have Sea Levels Been Rising For?
Sea levels have shifted throughout Earth's history. After the last Ice Age, around 20,000 years ago, the ocean rose by more than 125 metres as enormous continental ice sheets melted away. That process gradually slowed, and for about the last 2,500 years, levels stayed relatively stable.
Then the modern trend kicked in at the end of the 19th century and the start of the 20th, closely tied to growing greenhouse gas emissions from industrialisation. Research published in Nature in 2020, led by NASA's Jet Propulsion Laboratory with contributions from the National Oceanography Centre, traced the drivers of this rise all the way back to 1900.
How Much Have Global Sea Levels Risen by Since 1900?
In the past century, we have witnessed unprecedented global mean sea level rise. Between 1901 and 2018, there was an increase of about 20cm (roughly 8 inches) according to the IPCC’s Sixth Assessment Report.
Another way to picture it: over the past 140 years, tide gauges and satellites together show a total rise of somewhere between 21 and 24 centimetres. In European seas, sea level has risen by 2-4 mm/year on average over the past 26 years.
Is Sea Level Rise Accelerating?
Yes. According to the 2025 UK State of the Climate Report, sea level rise around the UK is accelerating, increasing the potential flood risk from storm surges.
- Since 1901, the sea level around the UK has risen by about 20.1cm (likely range 16.6 to 23.6cm), with two thirds of the rise happening over the last three decades.
- Over the past 33 years (1933-2025) the UK sea level estimated from tide gauges has risen by 13.9cm, although there are large uncertainties of sea level rise around the UK.
- The last 4 years were the highest on record for UK annual mean sea level from 1901, with the 21st Century so far (2001-2025) including the 18 highest years.
- Storm surges in the UK in 2025 mostly occurred on small or moderate tides, limiting their impact.
- The most severe surges were from storm Eowyn (January), Amy (October), and Bram (December). Had Eowyn arrived a week later, coinciding with a spring tide, the estimated total sea level at Heysham, Lancashire, would have made this a 1 in 300 year event.
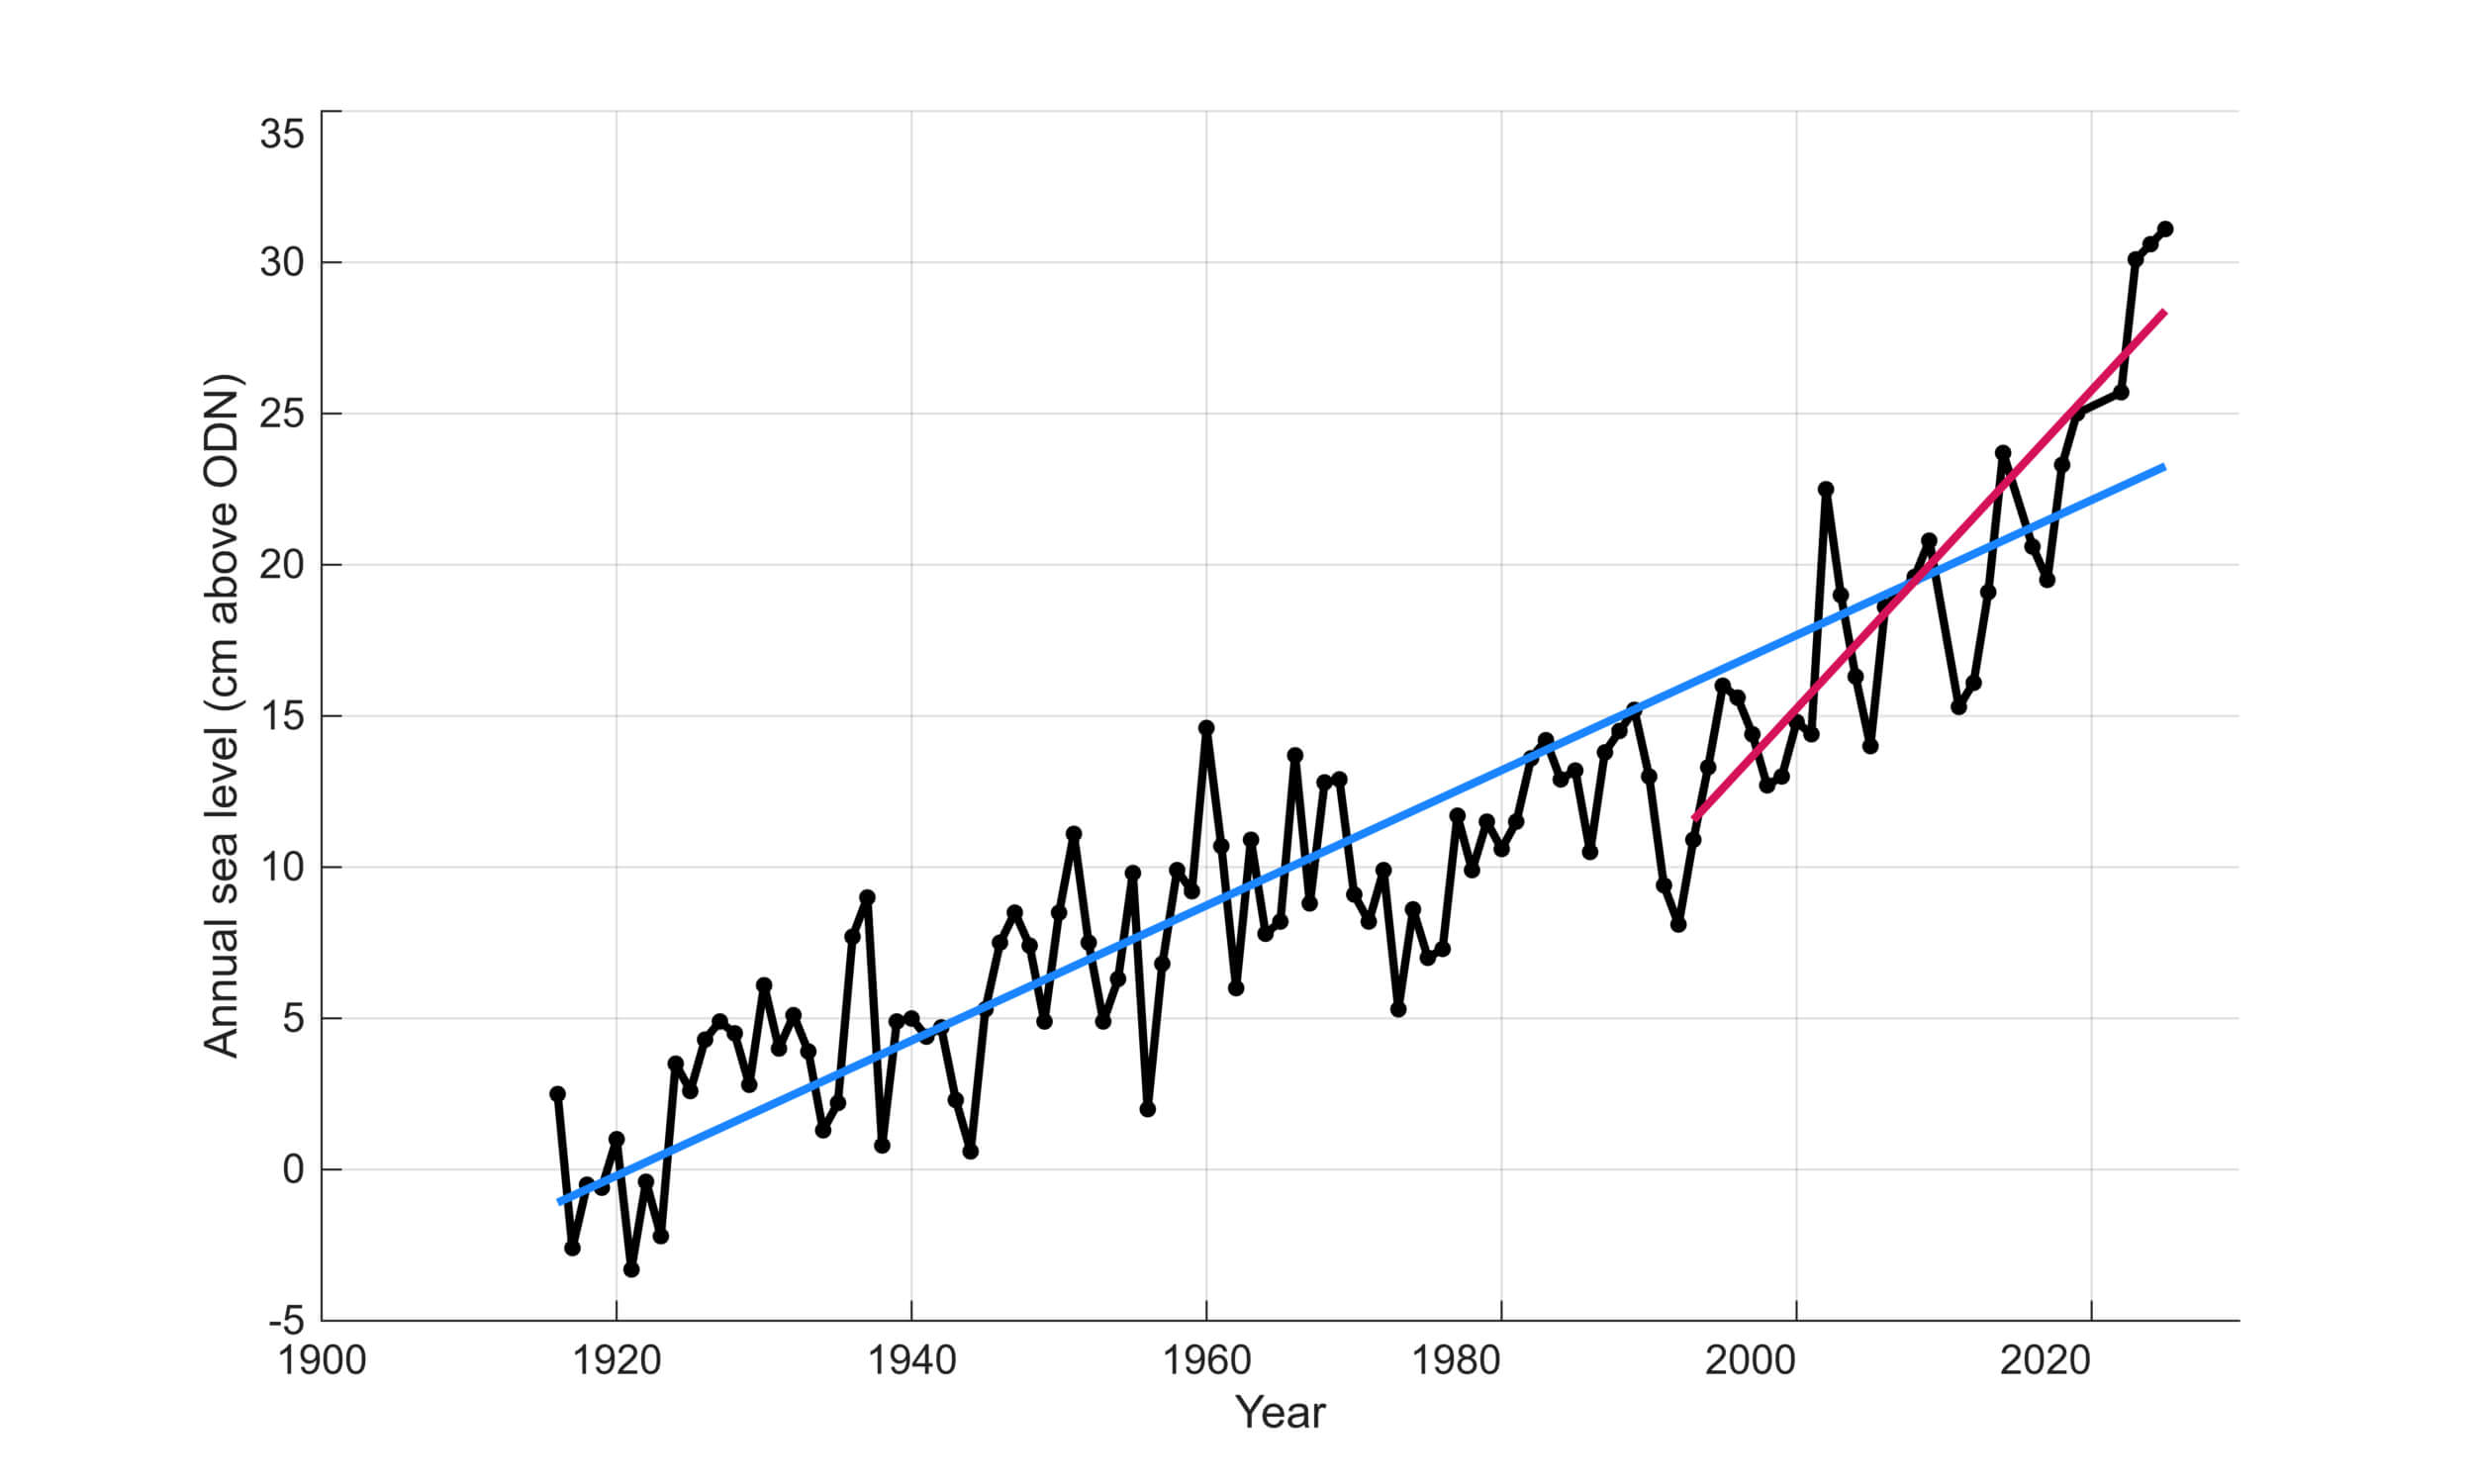
The graph above (credit: Andy Matthews) visualises tide gauge record from Newlyn (no vertical land movement corrections) since 1916. It provides observational evidence that sea level rise is accelerating, with two-thirds of that sea level rise happening in just over the last three decades.
Do Rates of Sea Level Rise Vary in Different Parts of the World?
Globally, sea level rise varies a great deal. Between 1993 and 2023, the ocean rose fastest in the Western Pacific and slowest in the Eastern Pacific. Some basins saw 15 to 20 cm of rise over that window, well above the global average (NOAA).
What explains the differences? Ocean currents and wind patterns redistribute heat unevenly. Gravitational effects from melting ice sheets pull water toward or away from certain coastlines. And local land movement, whether the ground is sinking or rising, shifts the picture at any given spot.
Sea level rise is not globally uniform and varies regionally. Thermal expansion, ocean dynamics and land ice loss contributions will generate regional departures of about ±30% around the GMSL rise. Differences from the global mean can be greater than ±30% in areas of rapid vertical land movements, including those caused by local anthropogenic factors such as groundwater extraction (high confidence). Subsidence caused by human activities is currently the most important cause of relative sea level rise (RSL) change in many delta regions. While the comparative importance of climate-driven RSL rise will increase over time, these findings on anthropogenic subsidence imply that a consideration of local processes is critical for projections of sea level impacts at local scales.
What is the Difference Between Global Sea Level Rise and Relative Sea Level Rise?
Global sea level rise is the average increase in ocean height right across the planet. Satellites measure it from orbit, and it's what scientists use to track the big-picture trajectory of climate change.
Relative sea level rise is what matters at any specific location. It's the change in water level compared to the ground at a given coastal point. Where the land is sinking (land subsidence), relative rise outpaces the global average. Where the land is still bouncing back upward, as in parts of Scandinavia where the crust is recovering from the weight of Ice Age glaciers (a process called post-glacial rebound), relative rise can be slower.
For coastal communities weighing up flood defences, infrastructure, and long-term plans, relative sea level rise is the number that matters most.
Why Might Sea Level Rise be Underestimated?
A few reasons.
First, ice sheets. Antarctica and Greenland hold enough frozen water to raise global sea levels by more than 6-9 metres combined. But the way they respond to warming involves processes scientists still don't fully grasp: marine ice sheet instability, ice cliff collapse, and the fracturing of ice shelves by surface meltwater. Current models struggle to capture these behaviours, which is exactly why the IPCC includes separate low-likelihood, high-impact scenarios alongside its main projections.
There's also a track record worth noting. IPCC projections have been bumped upward with each successive report. The AR6 figures are higher than those in the AR5, which were themselves around 60% higher than the AR4. Time after time, earlier estimates have turned out to be too conservative.
How Much are Sea Levels Predicted to Rise in the Future?
That comes down to how much more greenhouse gas we put into the atmosphere. The IPCC's Sixth Assessment Report lays out several sea level projections tied to different emissions pathways.
Under a very low emissions scenario (SSP1-1.9), the likely rise by 2100, measured against a 1995 to 2014 baseline, would be between 0.28 and 0.55 metres. Under a very high emissions scenario (SSP5-8.5), that range jumps to 0.63 to 1.01 metres.
One thing to keep in mind: the rise won't stop in 2100. Sea levels will keep climbing for centuries beyond that, because oceans take a long time to absorb heat and ice sheets respond slowly to warming we've already locked in.
How are Sea Levels Monitored and Tracked?
Two methods do the bulk of the work.
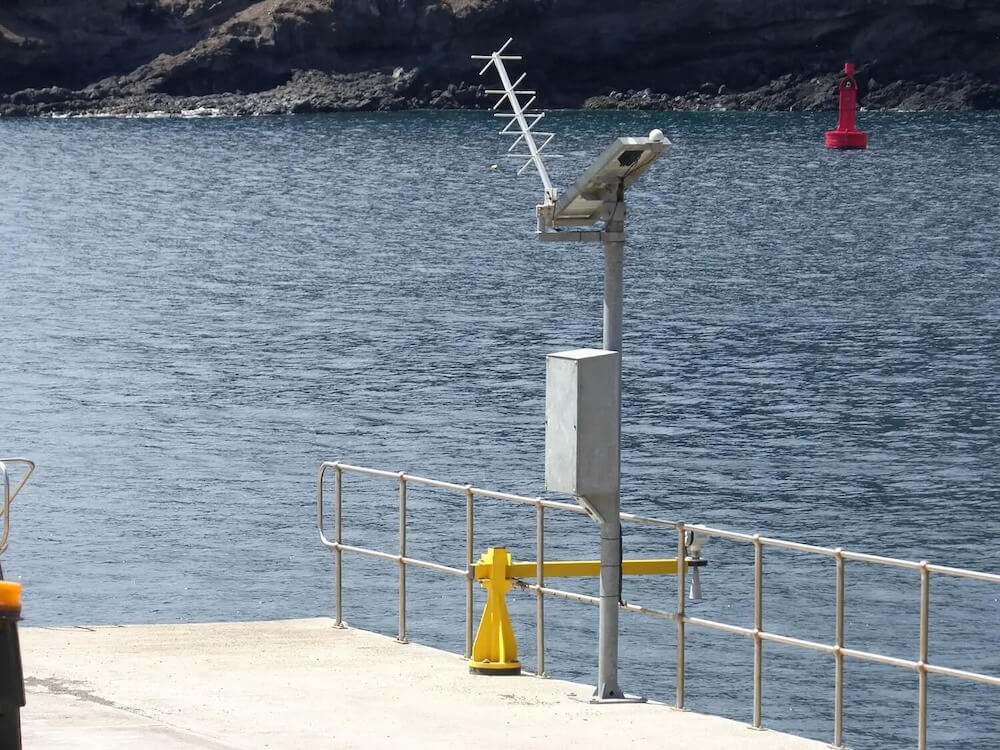
Tide gauges have been recording coastal water levels for well over a century. Found at coastal stations around the world, they measure the daily rise and fall of tides and give us long-running records of local sea level changes. Scientists pool data from hundreds of these stations to calculate global averages.
NOC staff at the Permanent Service for Mean Sea Level (PSMSL) and the British Oceanographic Data Centre (BODC) are responsible for the collection, publication, analysis and interpretation of sea level data from the global network of tide gauges - including the Core Network of GLOSS gauges, for the Intergovernmental Oceanographic Commission (IOC) of UNESCO.
Satellite altimeters changed the game from the early 1990s onward. Starting with TOPEX/Poseidon in 1992, a series of satellites (Jason-1, Jason-2, Jason-3, and now Sentinel-6) have measured the height of the ocean surface by bouncing radar pulses off the water and timing how long the signal takes to come back. They cover about 90% of the world's oceans and can measure sea surface height to within a few centimetres.
Other missions add another piece to the puzzle, with many countries across the world launching satellites. NASA (USA) have GRACE and GRACE-FO, China has Haiyang, India has Oceansat and EU missions include Sentinel 3 and SARAL. Collectively, these help pinpoint where the water is coming from.
If you want to explore the latest data and trends yourself, the Met Office climate data portal and the Copernicus ocean climate portal are great places to start.

What are the Impacts of Sea Level Rise?
Even modest rises in sea level amplify how far and how often flooding reaches. High tide flooding that used to happen five times a year during the 1960s and 1970s was occurring more than eight times a year by the 2000s and 2010s. Storm surges ride on a higher baseline, pushing saltwater further inland.
Learn MoreRising waters eat away at beaches, cliffs, and wetlands, wiping out habitats and putting property at risk.
Learn MoreAs the sea pushes into rivers and underground freshwater supplies, it contaminates drinking water and ruins farmland. Low-lying deltas in Bangladesh, Vietnam, and the Pacific Islands are especially exposed.
Learn MoreTidal marshes, mangrove forests, and coral reefs are all under increasing pressure. Coastal forests drowned by saltwater turn into "ghost forests," a visible marker of the ocean creeping inland.
Learn MoreEven 20 cm of additional rise by 2050 could trigger at least $1 trillion per year in flood damages across the world's 136 largest coastal cities (Nature).
Learn MoreWhich Places are Most Under Threat from Sea Level Rise?
Low-lying island nations are on the front line. For some, the question isn't whether they'll be affected but whether their land will stay above water at all.
Pacific states like Fiji, Vanuatu, Tuvalu, and the Solomon Islands are already seeing people displaced and habitable land disappear.
In Asia, the risks are enormous. Coastal megacities like Jakarta, Shanghai, Mumbai, Dhaka, Bangkok, Ho Chi Minh City, and Manila face rising seas compounded by fast-sinking ground from heavy groundwater extraction. Nine out of ten of the world's most flood-exposed cities are located in south-eastern regions of Asia.
In the United States, Florida is the most vulnerable state. Thirty-six of the country's 50 most at-risk coastal cities are there. New York faces serious exposure too; by 2050, nearly half a million New Yorkers could be living on threatened land, according to Climate Central.
Africa's coastal communities are increasingly at risk as well. Egypt, Mozambique, and Tanzania are projected to see the largest numbers of people hit by annual coastal flooding by the end of the century. Lagos and Alexandria face growing threats.
European cities aren't sheltered from this. London, Amsterdam, Hamburg, and Venice all need strong adaptation strategies to handle what's coming over the next few decades.
What are Natured-Based Solutions to Sea Level Rise and do They Work?
Nature-based solutions work with natural habitats to shield coastal communities from flooding, coastal erosion, and storm surge. They won't stop sea level rise on their own, but they're proving good at softening its effects, often at a fraction of the cost of traditional engineering.
Mangrove forests are a strong example. Their dense root systems absorb wave energy, trap sediment, and gradually build up the land surface. Importantly, mangroves can keep pace with moderate rates of sea level rise by accumulating material over time, something seawalls simply can't do. Restoring them is estimated to be five times cheaper than building concrete and steel defences for the same level of coastal protection.
Salt marshes work in a similar way, weakening waves and limiting how far storm surges reach. In the United States, coastal wetlands provide an estimated $23.2 billion in annual storm protection. During Hurricane Sandy in 2012, they prevented an estimated $625 million in property damage.
Coral reef and oyster reef restoration helps too. San Francisco Bay's Living Shorelines project, for instance, reduced wave energy by 30 to 50%.
There's growing evidence that blending these natural approaches with conventional coastal management produces the strongest outcomes. On Java's northern coast, communities are regenerating mangrove forests using simple brushwood barriers, a low-cost method championed by Wetlands International that protects livelihoods and creates new habitat. But nature-based solutions still receive only a tiny share of global climate adaptation funding, with estimates pointing to roughly 1% of the total (Science Direct).
Can We Reverse Rising Sea Levels?
Not on any timescale that matters for people alive today. If every country stopped all greenhouse gas emissions tomorrow, the ocean would still keep rising for centuries. The heat already absorbed and the slow response of ice sheets guarantee that. The IPCC is direct about this: many changes driven by past and future emissions are irreversible for thousands of years, particularly for the ocean, ice sheets, and global sea level.
What's still in our hands is how fast and how far levels ultimately climb. Quick, deep cuts to emissions would hold the rise closer to the lower end of projections. Waiting longer pushes us toward scenarios where ice sheets cross climate tipping points and trigger metres of irreversible rise.
Reversal isn't realistic. But the gap between strong action and doing nothing is massive. We're talking about the difference between something communities can adapt to and something they can't.
Other Frequently Asked Questions About Sea Level Rise
Sea level rise is a slow, long-term trend: the gradual creep upward of the ocean's baseline height. Coastal flooding is different. It's a short-term event triggered by storms, heavy rain, or unusually high tides.
They're tightly connected, though. Rising seas make coastal flooding worse. A storm surge that might have fallen short of a neighbourhood 50 years ago now reaches further and hits harder because it starts from a higher water level. Moreover, mean sea-level rise and coastal squeeze (and changes in sediment supply) are contributing to a decline in the extent of saltmarshes, shingle beaches and sand dunes, which act as a natural buffer to flooding (MCCIP).
It already is, in some places. Communities across Pacific Islands like Fiji and the Solomon Islands have been moved away from eroding coastlines. In Bangladesh, millions have left coastal areas for cities like Dhaka after saltwater intrusion ruined their farmland.
The World Economic Forum reported in 2025 that rising seas were affecting 1 billion people globally. By 2050, an estimated 230 million people will be living within just 1 metre of current sea level. As extreme weather gets worse and habitable coastal land shrinks, climate migration will become one of the defining challenges of this century.
The split has changed over time. For much of the 20th century, thermal expansion and melting glaciers were the biggest contributors. Since the 2000s, ice sheet loss from Greenland and Antarctica has picked up sharply. By recent years, roughly two-thirds of annual sea level rise came from melting ice, with about a third from thermal expansion.
In 2024, that balance flipped. Thermal expansion drove around two-thirds of the year's rise, pushed by record-breaking ocean temperatures. Year-on-year swings like that are normal. But zoom out, and the long-term picture shows ice loss taking on a bigger and bigger role.
Antarctica is the biggest question mark in sea level projections. Its ice sheet holds enough frozen water to raise global sea levels by around 58 metres if it all melted. That would take thousands of years, but the sheer scale shows what's at stake.
The IPCC estimates Antarctica will likely add between 0.03 and 0.34 metres of rise by 2100, depending on emissions. Those numbers come with heavy uncertainty, though, because poorly understood processes like marine ice sheet instability and ice cliff collapse could dramatically change things. The West Antarctic Ice Sheet is where most of the risk sits.
The Thwaites Glacier, sometimes called the "Doomsday Glacier," already accounts for about 4% of global sea level rise. If its floating ice shelf breaks apart and the glacier becomes unstable, the effects could spread across the whole of West Antarctica. A full collapse of the West Antarctic Ice Sheet would add roughly 4.3 metres to global sea levels over time. What happens in Antarctica over the coming decades will largely determine how fast and how far rising sea levels go for centuries after that.
Dive Deeper: NOC's Sea Level Rise Research
The National Oceanography Centre and its predecessors have been at the forefront of sea level science for over a century. NOC maintains the UK’s national tide gauge network, providing high quality sea-level information to monitor long term sea level change at coastal locations across the UK, with the distribution and quality control of the data managed by the British Oceanographic Data Centre (BODC).